100 Baggers - Indian Context
Feb 05, 2026Since 1996, Motilal Oswal group has been releasing Annual Wealth Creation Study. It is a wonderful study which focuses on Indian Market and what were the wealth creators in last 5 years. Reading the reports over the years , one can see the evolution of Indian markets over last 30 years.
I came across this report from the book 100x Baggers, where Christopher Mayer mentioned this study. Particularly, analysis from 2014 report - 19th Annual Wealth Creation Study (2009-2014) captured in the report section 3 : “The essence of 100x”.
I found this useful as now it maps the whole 100x baggers into indian context. It was wonderful to see how mucht the principals of 100x captured for US market are also relevant in Indian context. And I should not be surprised, Corporate structure, accounting and growth are similar global. There might be Indian market specific sectors, but the core principles of finding companies with good growth potential available at a reasonable price holds true everywhere.
The report evolved a bit from 2014 to 2025. Let me start by capturing the key points from 2014 report on what it takes to be 100x.
First, the 100x Proof
- There were 47 “Enduring” Companies which grew 100x in 20 years from 1994-2014
- Stress on enduring as analysis ignored the companies which went 100x and fizzled out (Satyam, NIIT, Unitech) which were 100 more such companies. But there is not much to learn from there. What we are interested in is understanding pattern which helps to grow and sustain the company.

- Even though number of companies is small (47), each company offered multiple chances between 1994-2009 to buy and still give 100x return.

- This point is repeated time and again. Just because a stock has already gained momentum and multiplied doesn’t mean that you can’t extract value from it. It should make sense at current level and not be afraid of past accelerated performance.
As investors, the key takeaway from this is that we need not worry even if we have missed a multi-fold price rise in a potential 100x by not buying into it 1, 2 or even 5 years ago. In other words, when it comes to 100x stocks “it is dawn when you wake up!” Or more accurately, “when the 100x idea dawns on you, simply wake up and buy the stock!”
100x Principles
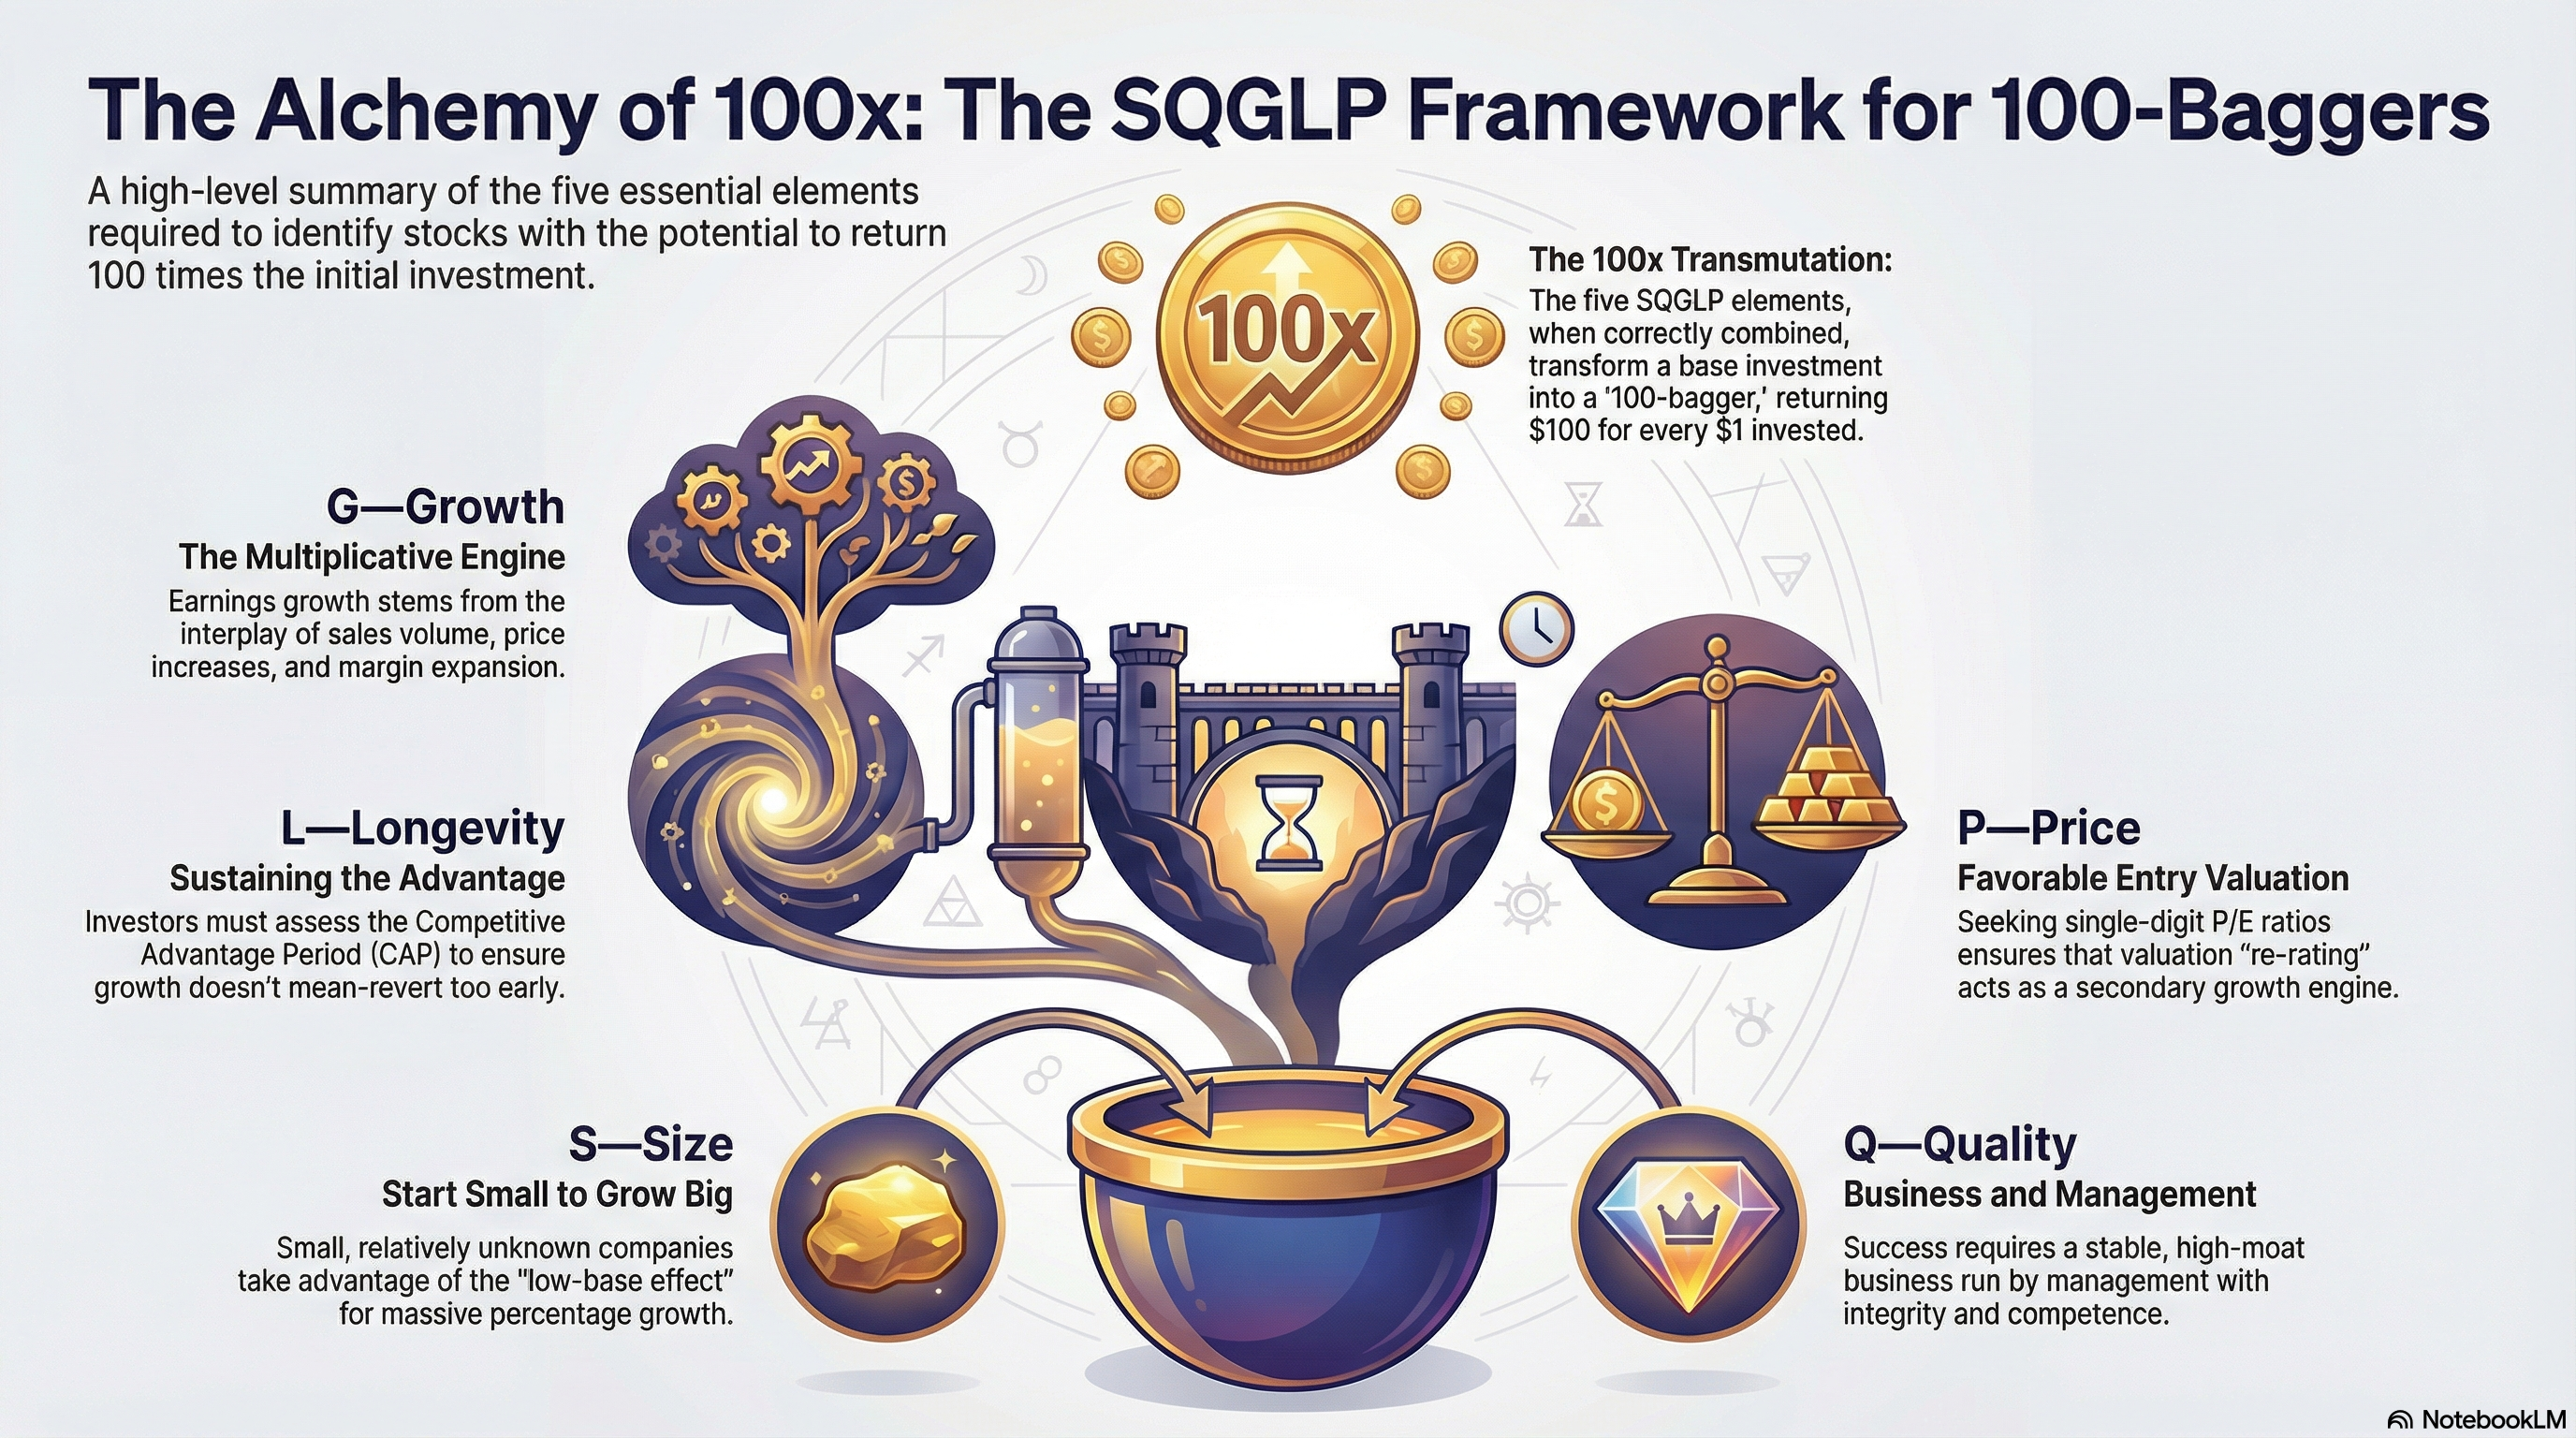
Our analysis of the 100x stocks suggests that their essence lies in the alchemy of 5 elements forming the acronym SQGLP – Size (of company), Quality (of business and management), Growth (in earnings), Longevity (of both quality & growth) and Price (favorable valuation). We discuss each of these 100x essential elements in the following sections.

Element 1 : Size
Size is the first differentiator because it leaves room for growth for multiple reasons
1.1 The Base effect (The Maths of size)
-
Small companies can achieve high percentage changes from small absolute gains, which is mathematically impossible for “oak trees” like HDFC or Reliance.
-
Large Cap: HDFC Bank
- Current Size: ~₹14.3 Lakh Crores (Market Cap)
- The Challenge: For HDFC Bank to double (become a 2-bagger), it needs to add another ₹14.3 Lakh Crores in value.
- They already have nearly 9,000 branches. They are on almost every main street in India.
- To Double: They need to find space for another 9,000 branches. Where will they put them? Every good location is already taken. They have hit “Saturation.”
-
Mid Cap: IDFC First Bank
- Current Size: ~₹72,000 Crores (Market Cap)
- The Opportunity: For IDFC First Bank to double, it only needs to add ₹72,000 Crores in value.
- What it takes: This is roughly 5% of HDFC Bank’s current size. They have roughly 900 branches.
- To Double: They only need to open another 900. There are hundreds of towns in India where they don’t have a single branch yet. They have “Empty Space” to grow into.
Let’s compare Nestlé India (Large Cap) with Mrs. Bectors/Cremica (Mid/Small Cap).
-
Large Cap: Nestlé India (Makers of Maggi)
- The Situation: Maggi is already available in almost every single village shop in India. Everyone knows it; everyone eats it.
- The Problem: To double their sales, they essentially need to convince every Indian to eat two packets of Maggi a day instead of one. Changing human behavior is incredibly hard.
Mid Cap: Mrs. Bectors (Makers of Cremica Biscuits)
- The Situation: Their biscuits are very popular in North India, but you might struggle to find them in South India or small villages in the East.
- The Advantage: To double their sales, they don’t need to change anyone’s eating habits. They simply need to send trucks to South India and start selling there.
-
What to Check : Mid to Micro Cap
1.2 Market Discovery / Relative Unknown-ness
Large-cap stocks are already owned by almost every mutual fund, pension fund, and ETF. There are very few “new buyers” left to drive the price up drastically.
- Under-owned: Mid-caps are often under-owned by big institutions.
- The Catalyst: When a mid-cap delivers consistent quarters, it enters the radar of large institutional funds. As these funds rush to build positions, the massive influx of liquidity drives the stock price up aggressively. You are essentially buying before the “big money” moves in.
 What to Check

  - Low holding by Institutes
    -  (FII Holding < 5 AND DII Holding < 5 AND (FII Holding + DII Holding) > 0.5)
  - Low number of brokerage analysts covering the stocks
    - **Where to check:** Moneycontrol Analyst section or Trendlyne "Forecaster" or Tickertape. If you search for the stock and see "No Forecasts Available," that is a positive signal for "unknown-ness."
    - **The Sweet Spot (Target):** **0 to 3 Analysts, till 10 it is relatively unknown**.
  - Relatively low traded volume
    - **The Metric:** **Daily Turnover Ratio** (Daily Traded Value / Market Cap).
    - **How to Quantify:**
      - **High Attention (HDFC/Reliance):** Usually trade **0.5% to 1.0%** of their Market Cap daily.
      - **The Sweet Spot (Target):** Trades **0.05% to 0.2%** of its Market Cap daily.
| Indicator | The “Hidden Gem” Target Range |
|---|---|
| FII + DII Holding | 1% to 10% (Ideally rising slightly) |
| Analyst Count | 0 to 3 Brokerages |
| Daily Turnover | < 0.1% of Market Cap (Active but quiet) |
Element 2 : Quality
In my opinion, this is the single most important factor. There are two aspects to Q in SQGLP
- Quality of Business
- Quality of Management
The quality of an organization can never exceed the quality of the minds that make it up.
2.1 Quality of Business
Quality of business needs to be assessed for factors like existing or potential size of profit pool for the industry (and hence the company), competitive landscape, potential for sustained above cost-of-capital return on investment, etc.
2.1.1 Profit Pool
- From Motilal Oswal Report from 2014 :
Profit Pool is the aggregate level of absolute profit earned by all players in a sector. The tables here presented in this section suggest that 10 sectors alone accounted for 94% of India Inc’s aggregate corporate profits in FY14. Juxtaposing these with the 100x stocks, it is evident that almost all of them emerge from high Profit Pools.
We analyzed the businesses of the past 100x companies and observed All the players are from sectors which enjoy large Profit Pool.
- The point is simple : look for stocks which operates in growth area. If a sector has tailwind, there is high probability of a stock benefitting from the growth.
- From 2025 Report, these were the sectors identified for growth / tailwind
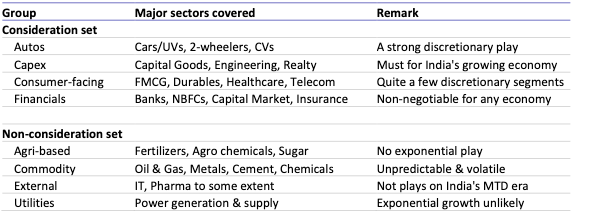
- In my view, IT and Pharma should be included. India has solid base of generic pharma and now with the latest partnership with EU, this can accelerate. And IT is backbone of every improvement ; this can not be dismissed.
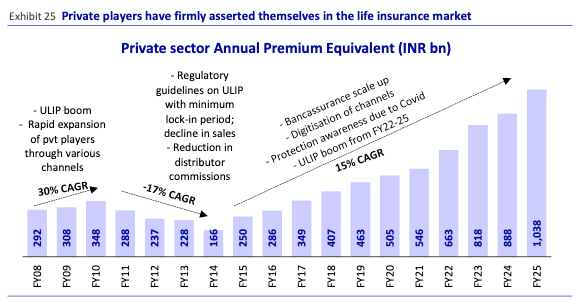
- In Financials, need to dig deeper on the insurance. Especially are there companies which use the float of insurance to invest further in growth. The way Berkshire Hathway has achieved by re-investing the insurance premium money
2.2.2 Value Migration
This was important and comprehensive enough that I wrote a separate section on this here
2.2 Quality of Management
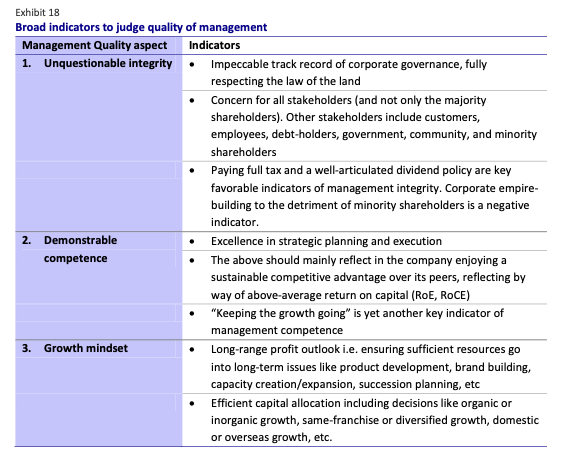
We believe there are 3 key aspects to quality of management: (1) Unquestionable integrity, (2) Demonstrable competence and (3) Growth mindset. But even these are subjective and non-quantifiable issues. Thus, assessing quality of management is a true art rather than science.
We list below some indicators which can serve as a broad checklist for this process.
Need to automate and build the framework to analyse quality of management.
Element 3 : Growth
We draw an analogy of 100x with a 100-storey building. The somewhat invisible yet most important part of the building is its foundation. It is only upon a strong foundation that a 100-storey superstructure can be built. Likewise, for 100x, small size and quality of business and management are the foundation. Upon this foundation comes the superstructure in the form of 100-fold growth in stock price.
“Growth in earnings via multiplicative interplay of volume, price, margin”
For a stock to return 100x, two aspects need to improve : Its earning and its valuation. This element focuses on Stock Earning Growth. Growth has 4 dimensions
- Volume growth – a function of demand growth matched by company’s capacity to supply;
- Price growth – a function of company’s pricing power, which in turn is a function of the competitive landscape
- Operating leverage – a function of the company’s operating cost structure; higher the fixed cost, lower the unit cost incidence and higher the operating leverage
- Financial Leverage – a function of the company’s capital structure; higher the debt-equity, higher the financial leverage and vice versa.
The 4 Lever Framework: Decomposing Earnings Growth
This framework is an application of the mathematical “chain rule” to financial statements. It decomposes Earnings Per Share (EPS) Growth into its constituent drivers to pinpoint the source of a company’s performance.
1. The Formula
The logic relies on canceling out intermediate terms to arrive at the final EPS growth figure:
\[\Delta \text{EPS} = \Delta \text{Vol} \times \frac{\Delta \text{Sales}}{\Delta \text{Vol}} \times \frac{\Delta \text{EBIT}}{\Delta \text{Sales}} \times \frac{\Delta \text{EPS}}{\Delta \text{EBIT}}\]Where $\Delta$ (Delta) denotes percentage change.
2. The Four Levers Defined
I. Volume Growth ($\Delta \text{Sales Volume}$)
- What it is: The increase in the actual number of units sold.
- Significance: This represents organic growth. It indicates rising demand for the product and market share expansion.
II. Price Lever ($\frac{\Delta \text{Sales}}{\Delta \text{Sales Volume}}$)
- What it is: The “Pricing Power.” If Sales grow faster than Volume, the company has raised prices.
- Significance: Measures inflation pass-through capability or premiumization.
- Ratio > 1: The company successfully raised prices.
- Ratio < 1: The company may be discounting to move volume.
III. Operating Lever ($\frac{\Delta \text{EBIT}}{\Delta \text{Sales}}$)
- What it is: Also known as the Degree of Operating Leverage (DOL). It measures how sensitive operating profit (EBIT) is to changes in sales.
- Significance: Reflects cost structure efficiency.
- Companies with high fixed costs (e.g., manufacturing) have high operating leverage. A small increase in sales leads to a large jump in EBIT because fixed costs are spread over a wider base.
IV. Financial Lever ($\frac{\Delta \text{EPS}}{\Delta \text{EBIT}}$)
- What it is: Also known as the Degree of Financial Leverage (DFL). It measures how sensitive EPS is to changes in EBIT.
- Significance: Reflects the capital structure (Debt vs. Equity).
- Because interest expenses are fixed, as EBIT rises, the earnings available to shareholders (Net Income) rise disproportionately fast.
- Risk Note: High financial leverage amplifies growth in good times but accelerates losses in bad times.
Summary: Analyzing Quality of Growth
This framework allows an investor to grade the quality of a company’s growth:
| Quality | Primary Drivers | Description |
|---|---|---|
| High Quality | Volume + Operating Lever | Growth is driven by selling more units and achieving economies of scale. |
| Low Quality / Risky | Financial Lever + Price Hikes | Growth is driven by taking on debt or aggressive pricing that may eventually hurt demand. |
Quality vs Growth
We believe it is important to clearly distinguish between quality of a company and its growth prospects.
-
Quality: Quality of a company is a function of (1) Quality of its management, and (2) Quality of business (mainly in terms of profitability measured in terms of return on capital i.e. RoCE and RoE).
-
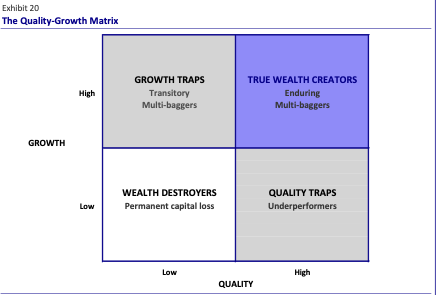
Growth: Growth is not a function of Quality alone, but several other factors discussed earlier – value migration, demand-supply dynamics, competitive landscape, etc. In binary terms, for any given company, Quality can be High or Low and Growth can be High or Low. Accordingly, it is possible to draw up a 2x2 Quality-Growth matrix as under –
Element 4 : Longevity
This is sort of no brainer but whole idea is company grow for a longer period. Hence while good quality and good growth is important, the next axis is company’s ability to sustain it for a longer period of time. For a growing pond, lot of competitors will enter and drag down the return in an attempt to capture the market. Company need to have a moat to sustain the growth, bringing in thYe longevity
Element 5 : Price
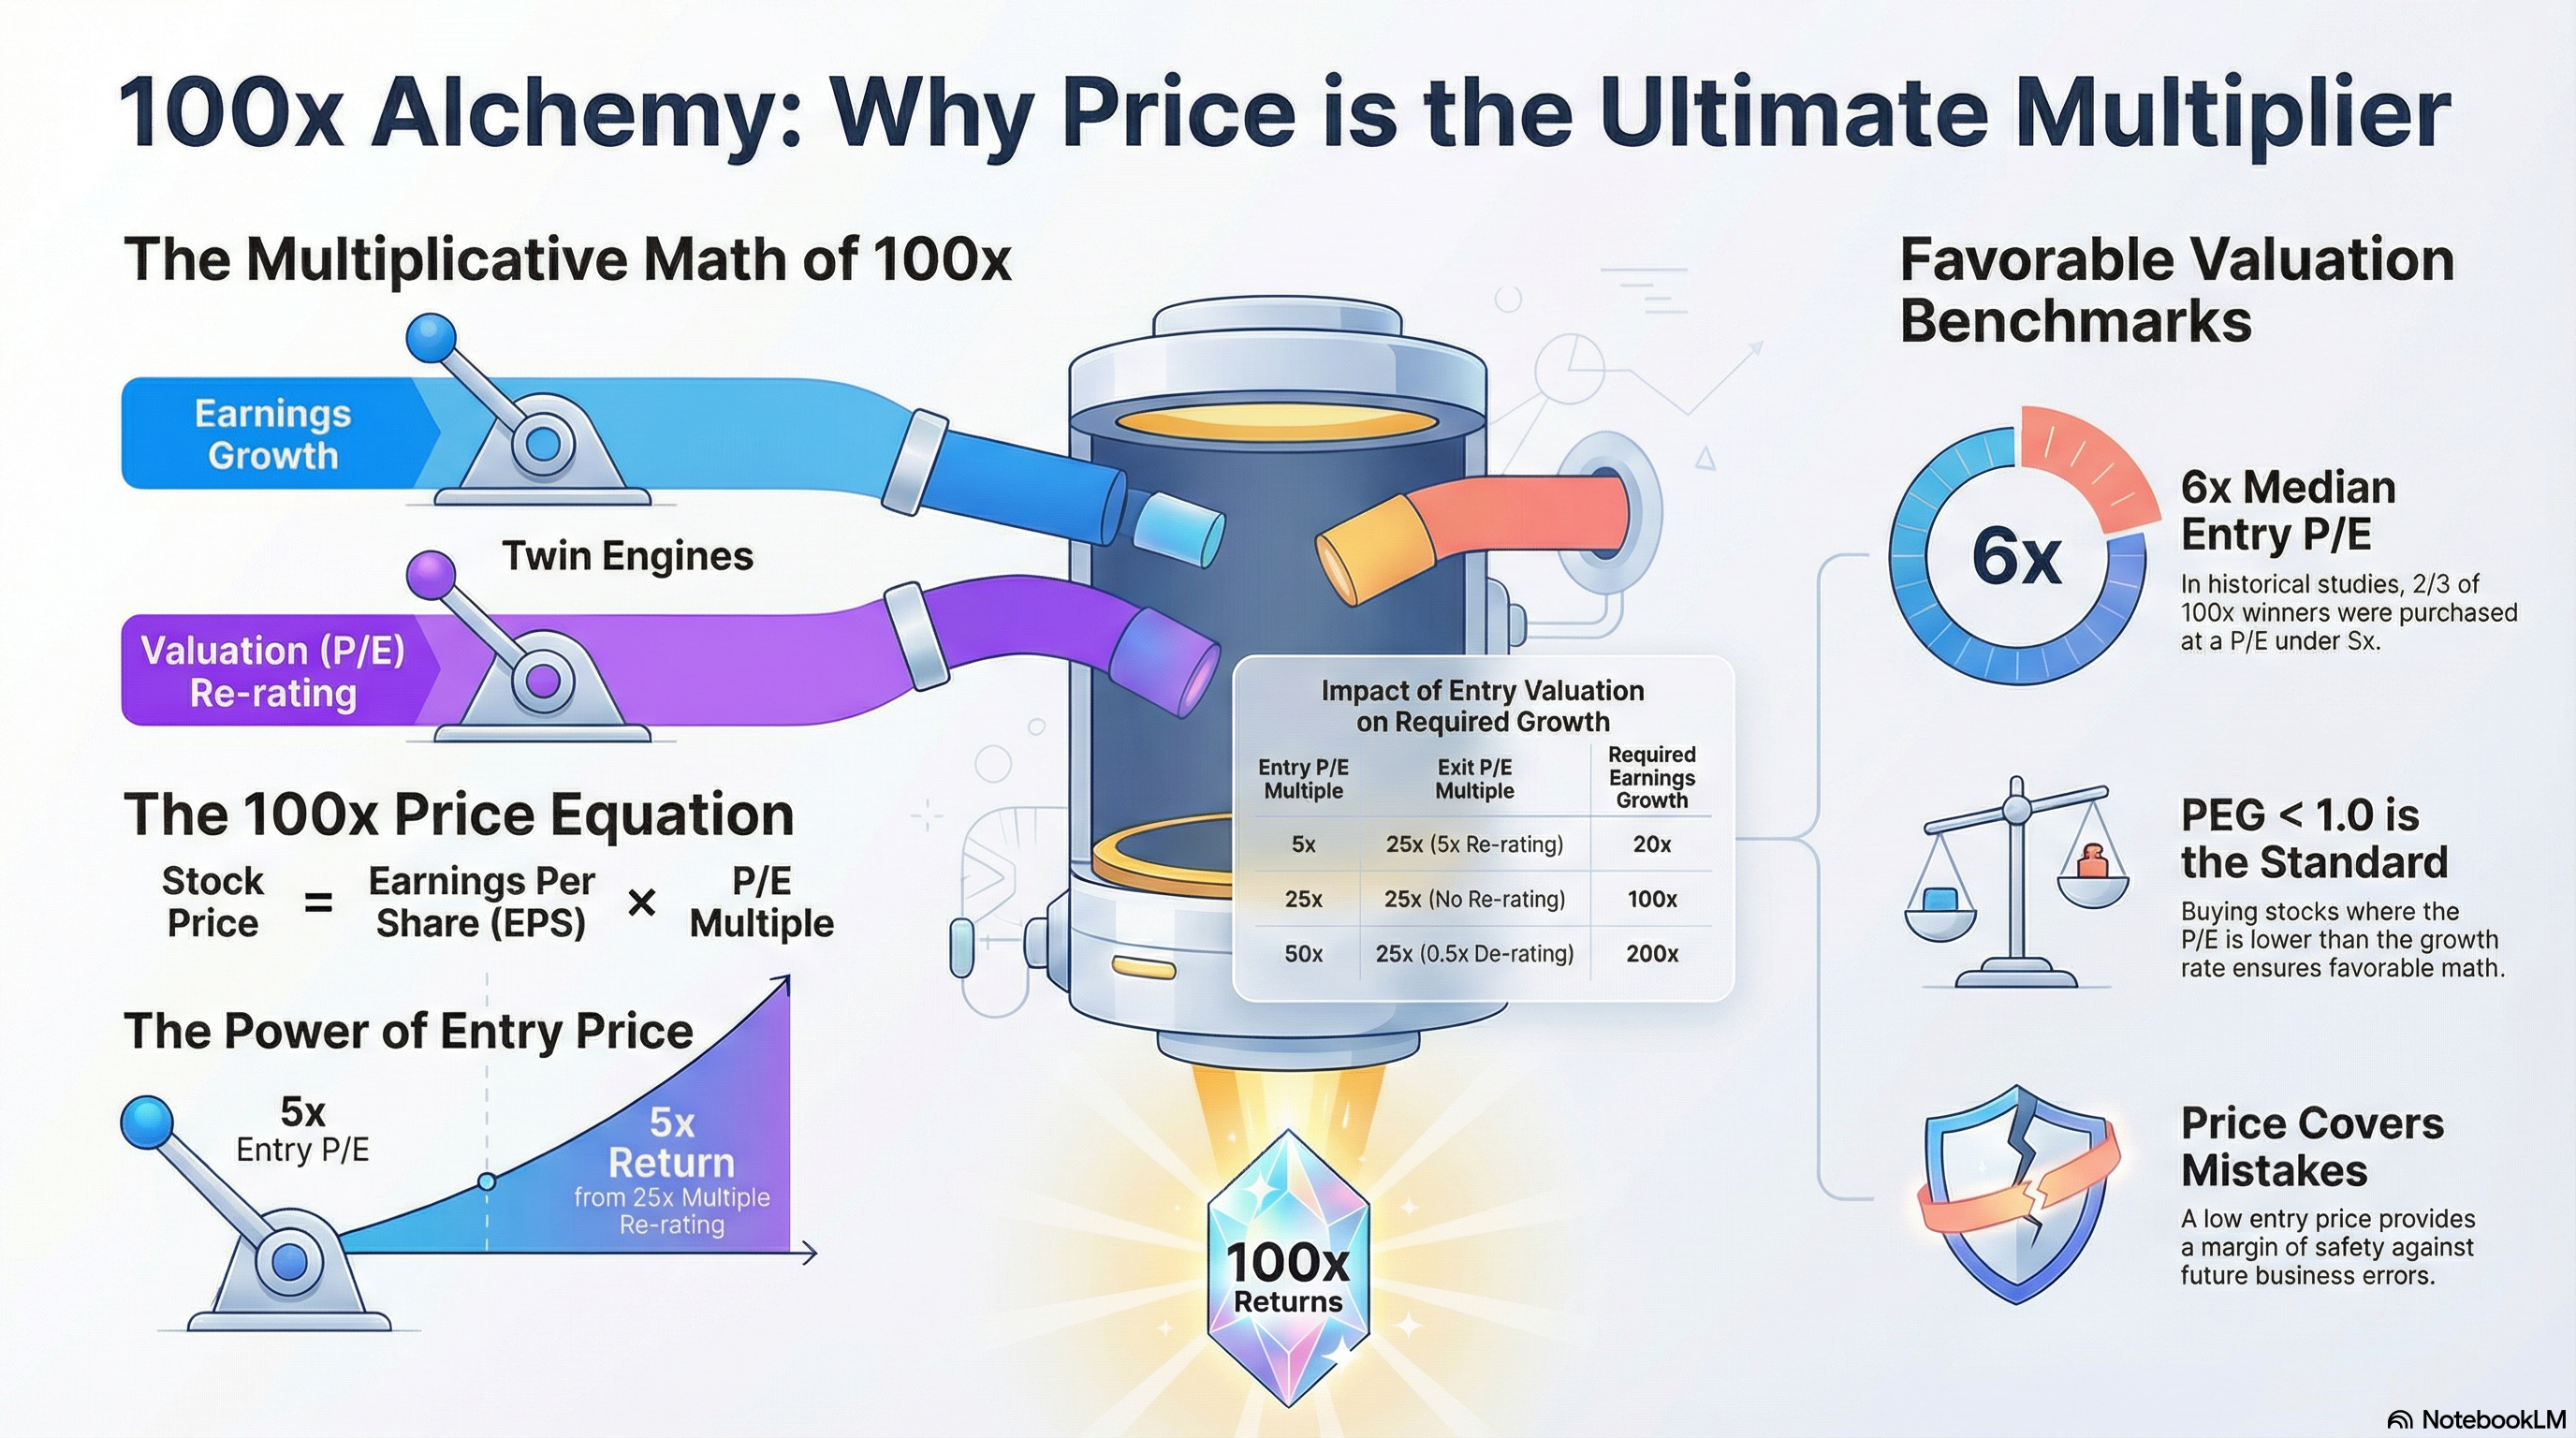
Company can tick all the factors : Good growth, good quality, solid moat. But if one overpays for the company, it is difficult to have a meaningful return. Barring exceptional situations, the stock price is a multiplicative function of earnings and its valuation. This may be reduced to a simple equation as under :
- Stock Price = Earnings Per Share x P/E … Equation 1
- Or, Market Cap = Profit After Tax (PAT) x P/E … Equation 2
Given the above, 100-fold growth in stock price can arise by any of the following means –
- A 100-fold growth in earnings, or
- A 100-fold growth in valuation, or as is typically a case
- A combination of earnings growth and valuation growth
(e.g. 25-fold earnings growth with 4-fold valuation growth)..
So, if one starts with a high valuation, then all the burden of growth lies on the earning. Hence, a less known stock with less valuation is usually attractive.