Part 2 : The Players
Jan 22, 2026The IPL Auction: Sizing Up India’s 5,000 Stocks
In Part 1, we looked at the scoreboard (the Sensex and Nifty 50). But to understand how the game is actually played, we have to look at the players.
There are more than 5,000 listed companies in India, but they are not created equal. Some are global giants, while others are tiny, risky startups.
To understand how these stocks behave and why their returns differ, we must classify them by their “price tag”. In finance, we call this Market Capitalization.
1. What is Market Cap?
Market Cap is the total value of a company as decided by the stock market.
If you want to buy the entire company from the market today by purchasing every share, this is what you would pay.
Formula :
Market Cap = Current Share Price × Total Number of Shares
As of Jan 2026, the entire India market is worth approx 450 lakh crore. Remember this number ; we will refer this again.
2. The Classification : How India Ranks Companies
In India, market capitalization categories are defined by the Association of Mutual Funds in India (AMFI) and updated every six months
As of Jan 2026 :
| Category | Rank | The “Gate” (Min. M-Cap) | Typical Company Size | Total Segment Size |
|---|---|---|---|---|
| Mega (Large) | Top 100 | ₹1,05,000 Cr+ | ₹2.8 Lakh Cr | ₹280 Lakh Cr |
| Mid Cap | 101 – 250 | ₹34,700 Cr | ₹60,000 Cr | ₹90 Lakh Cr |
| Small Cap | 251 – 500 | ₹11,000 Cr | ₹18,000 Cr | ₹45 Lakh Cr |
| Micro Cap | 501 – 750 | Under ₹11,000 Cr | ₹7,500 Cr | ₹11 Lakh Cr |
Simple Ways to Think About These Buckets
- Only the Mega Caps average above ₹1 Lakh Crore. These are the names everyone knows. You will find HDFC, TCS, LIC, Reliance here.
- A Mid Cap is roughly 3 times a Small Cap but only one fourth of a Mega Cap.
- The Micro Cap Floor:
- 501-750 Rank : This is what is typically watched by Mutual Funds / Institutions for investment.
- 750 - 1000 Rank : These companies typically average between ₹1,000 Crore and ₹2,500 Crore.
- Beyond Rank 1000, many are effectively penny stocks. We ignore them for serious study. Here the data gets noisy : liquidity becomes an issue, financial filings and price manipulation are strongly possible here.
3. Why these classification exists?
When I asked ChatGPT this question, this was the response :
Markets are categorized into these tiers primarily to help investors and fund managers manage risk, liquidity, and expectations.
Oh man, this sounds so technical and boring! As Steve Jobs would say: “Yuck!”
Let’s understand it differently. We are talking about Indian markets. What do we indian love more than money? Cricket!
So, think of this as IPL Mega option.
Think of these 2,000 companies are like players in the auction. Their “Market Cap” is their Auction Price tag.
1. Mega Cap (The Top Players)

These are the household names like Reliance Industries, HDFC Bank, and TCS.
- Traits: They have been around for decades, are highly stable, and rarely offer massive surprises. They move slowly but reliably, much like a seasoned veteran who always delivers a solid performance.
These companies drive indices like Nifty 50. 60% of total indian market cap is covered by these mega cap.
2. Mid Cap (The Seasoned Capped Players)
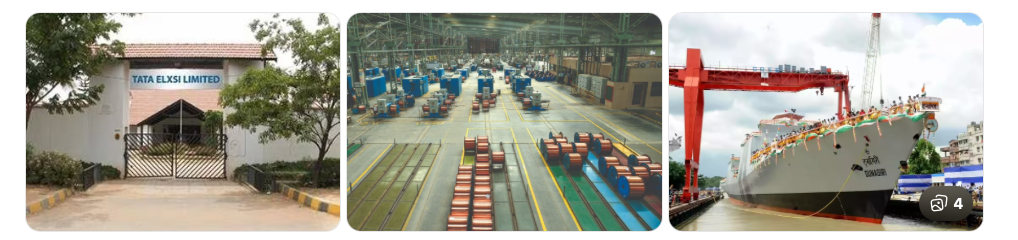
Companies like Tata Elxsi, Polycab India, and Mazagon Dock fit here.
-
Traits: These are proven performers that are growing fast but aren’t giants yet. This is often considered the “sweet spot”of the market—a perfect balance of growth and stability.
-
This is often called the sweet spot of the market.
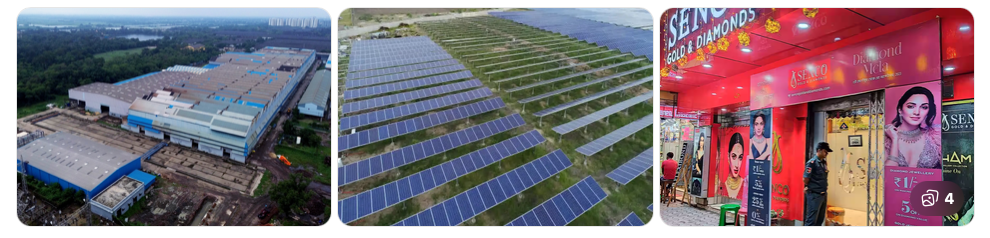
3. Small Cap (The Under-19 Sensations)

These are the rising stars in emerging sectors, like Suzlon Energy, CDSL or Kalyan Jewellers.
- Traits: They have high growth potential but come with much higher volatility. They can hit “sixes” frequently, but they can also lose their “wicket” (value) quickly because there is less public information available.
4. Micro Cap (The Uncapped and Risky Local Talent)
This is where you find “hidden gems” like Titagarh Rail or Gensol Engineering.
-
Traits: This is the high-risk, high-reward zone. Very few institutional “coaches” (Mutual Funds) are watching them. Information is scarce, and prices can be manipulated easily, but this is also where the biggest “multi-baggers” are born.
-
Investing here is like picking a player based on a tip from a local coach.
4. Summary : The Trade Off
As you move down the ladder from Mega to Micro:
- Growth Potential: Increases.
- Risk & Volatility: Increases.
- Information Quality: Decreases.
- Institutional Interest: Decreases.
| Feature | Mega Cap | Mid Cap | Small/Micro Cap |
|---|---|---|---|
| Stability | Very High | Moderate | Low |
| Growth Potential | Steady/Lower | High | Very High |
| Institutional Interest | High (FIIs/DIIs) | Moderate | Low to None |
| Information | Abundant | Available | Scarce |
| Volatility | Low | Medium | High |
5. Next Steps
Now that you know how to pick your “team” based on size, we need to look at the historical performance. In the next article, we compare how these different tiers and other assets like Gold have performed over the last 20 years to see where the real wealth was made.